Download data#
You can compose queries to download raw data.
import doplaydo.dodata as dd
import matplotlib.pyplot as plt
import pandas as pd
import getpass

username = getpass.getuser()

PROJECT_ID = f"rings-{username}"
device_data, df = dd.get_data_by_query([dd.Project.project_id == PROJECT_ID], limit=1)[
    0
]
device_data.pkey
6426
cell_id = device_data.device.cell.cell_id
cell_id
'RingDouble-20-0.25-'
device_id = device_data.device.device_id
device_id
'rings_RingDouble-20-0.25-_331580_121311'
device_data20, df20 = dd.get_data_by_query(
    [
        dd.Project.project_id == PROJECT_ID,
        dd.attribute_filter(dd.Cell, "radius_um", 20),
    ],
    limit=1,
)[0]
device_data20.pkey
6425
device_id_radius20 = device_data20.device.device_id
device_id_radius20
'rings_RingDouble-20-0.15-_331580_449331'
You have access to:
dd.Project
dd.Die
dd.Wafer
dd.ParentCell
dd.Cell
dd.Device
dd.DeviceData
Where each model has its table columns as attributes.

You can use get_data_by_query to query a subset of data filtered by a list of clauses.
It will return a list of tuples where the first element is a DeviceData object and the second one is a pandas DataFrame.
data_tuples = dd.get_data_by_query(
    [dd.Project.project_id == PROJECT_ID, dd.Device.pkey == device_data.device.pkey],
    limit=1,
)
device_data, df = data_tuples[0]  # each tuple has DeviceData and pd.Dataframe
device_data
DeviceData(pkey=6426, data_type=<DeviceDataType.measurement: 'measurement'>, thumbnail_path='device_data/6426/thumbnail.png', plotting_kwargs={'x_col': 'wavelength', 'y_col': ['output_power'], 'x_name': 'wavelength', 'y_name': 'output_power', 'scatter': False, 'sort_by': {}, 'x_units': None, 'y_units': None, 'grouping': {}, 'x_limits': None, 'y_limits': None, 'x_log_axis': False, 'y_log_axis': False}, valid=True, device_pkey=599, path='device_data/6426/data.json.gz', attributes={}, die_pkey=766, timestamp=datetime.datetime(2025, 2, 28, 21, 0, 58, 781535), timestamp_acquired=None)
device_data.device.pkey
599
df
| wavelength | output_power | polyfit | |
|---|---|---|---|
| 0 | 1500.000000 | 0.023748 | 6 |
| 1 | 1500.200401 | 0.025273 | 6 |
| 2 | 1500.400802 | 0.025884 | 6 |
| 3 | 1500.601202 | 0.026421 | 6 |
| 4 | 1500.801603 | 0.027372 | 6 |
| ... | ... | ... | ... |
| 495 | 1599.198397 | 0.004884 | 6 |
| 496 | 1599.398798 | 0.024192 | 6 |
| 497 | 1599.599198 | 0.025475 | 6 |
| 498 | 1599.799599 | 0.025529 | 6 |
| 499 | 1600.000000 | 0.025164 | 6 |
500 rows × 3 columns
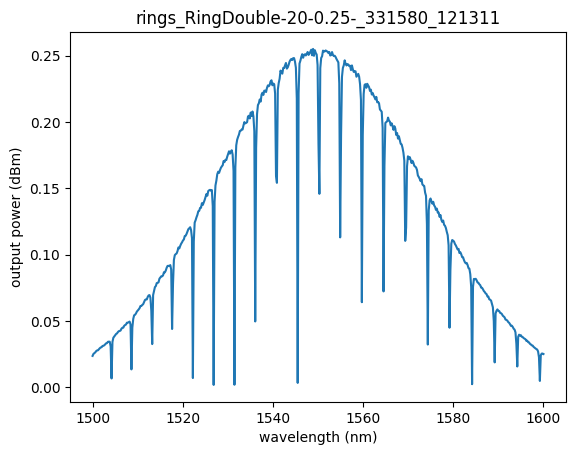
plt.plot(df["wavelength"], df["output_power"])
plt.xlabel("wavelength (nm)")
plt.ylabel("output power (dBm)")
plt.title(device_id)
Text(0.5, 1.0, 'rings_RingDouble-20-0.25-_331580_121311')
As you have 64 dies per wafer you get one measurement per die.
len(data_tuples)
1
You can aggregate the dataframes and the device data objects
dfs = [dt[1] for dt in data_tuples]  # dataframes
dds = [dt[0] for dt in data_tuples]  # device data objects
You can use the DeviceData object to traverse the data model and access additional fields.
You can go from DeviceData to any other tables by following the dashed arrows.
Each column is an attribute on the object representing the table.
print("device id: ", dds[0].device.device_id)
print("die x: ", dds[0].die.x)
print("die y: ", dds[0].die.y)
print("wafer id: ", dds[0].die.wafer.wafer_id)
print("cell id: ", dds[0].device.cell.cell_id)
print("parent cell id: ", dds[0].device.parent_cell.cell_id)
print("project id: ", dds[0].device.cell.project.project_id)
device id:  rings_RingDouble-20-0.25-_331580_121311
die x:  6
die y:  6
wafer id:  6d4c615ff105
cell id:  RingDouble-20-0.25-
parent cell id:  rings
project id: rings-runner
For example, you can reach the Cell table and all its columns:
dds[0].device.cell
Cell(cell_id='RingDouble-20-0.25-', timestamp=datetime.datetime(2025, 2, 28, 21, 0, 57, 95127), attributes={'x': 331580, 'y': 121311, 'gap_um': 0.25, 'radius_um': 20, 'kfactory:ports:0': "{'cross_section': '78687732_10000', 'info': {}, 'name': 'o1', 'port_type': 'vertical_te', 'trans': r270 -190600,-91240}", 'kfactory:ports:1': "{'cross_section': '78687732_10000', 'info': {}, 'name': 'o2', 'port_type': 'vertical_te', 'trans': r270 -63600,-91240}", 'kfactory:ports:2': "{'cross_section': '78687732_10000', 'info': {}, 'name': 'o3', 'port_type': 'vertical_te', 'trans': r270 63400,-91240}", 'kfactory:ports:3': "{'cross_section': '78687732_10000', 'info': {}, 'name': 'o4', 'port_type': 'vertical_te', 'trans': r270 190400,-91240}", 'kfactory:ports:4': "{'cross_section': '78687732_10000', 'info': {}, 'name': 'loopback1', 'port_type': 'vertical_te', 'trans': r270 -317600,-91240}", 'kfactory:ports:5': "{'cross_section': '78687732_10000', 'info': {}, 'name': 'loopback2', 'port_type': 'vertical_te', 'trans': r270 317400,-91240}", 'kfactory:settings': "{'gap': 0.25, 'length_x': 0.1, 'radius': 20}", 'kfactory:function_name': 'ring_with_gc'}, pkey=607, project_pkey=20)
Build table for JMP#
You can build a flat table by combining all the device data and pandas dataframes.
data_tuples = dd.get_data_by_query(
    [
        dd.Project.project_id == PROJECT_ID,
        dd.Device.device_id == device_id,
        dd.Die.x == 0,
        dd.Die.y == 0,
    ]
)
len(data_tuples)
dds = [dt[0] for dt in data_tuples]  # device data objects
dfs = [dt[1] for dt in data_tuples]  # dataframes
dfs[0]
| wavelength | output_power | polyfit | |
|---|---|---|---|
| 0 | 1500.000000 | 0.025158 | 6 |
| 1 | 1500.200401 | 0.025586 | 6 |
| 2 | 1500.400802 | 0.026157 | 6 |
| 3 | 1500.601202 | 0.026909 | 6 |
| 4 | 1500.801603 | 0.027305 | 6 |
| ... | ... | ... | ... |
| 495 | 1599.198397 | 0.027307 | 6 |
| 496 | 1599.398798 | 0.026967 | 6 |
| 497 | 1599.599198 | 0.025995 | 6 |
| 498 | 1599.799599 | 0.026009 | 6 |
| 499 | 1600.000000 | 0.025524 | 6 |
500 rows × 3 columns
dfs_all = []

for device_data, df in zip(dds, dfs):
    df["device_id"] = device_data.device.device_id
    df["die_x"] = device_data.die.x
    df["die_y"] = device_data.die.y
    df["wafer_id"] = device_data.die.wafer.wafer_id
    df["cell_id"] = device_data.device.cell.cell_id
    df["parent_cell_id"] = device_data.device.parent_cell.cell_id
    dfs_all.append(df)
dfs_all = pd.concat(dfs_all)  # You can concatenate all dataFrames together
dfs_all
| wavelength | output_power | polyfit | device_id | die_x | die_y | wafer_id | cell_id | parent_cell_id | |
|---|---|---|---|---|---|---|---|---|---|
| 0 | 1500.000000 | 0.025158 | 6 | rings_RingDouble-20-0.25-_331580_121311 | 0 | 0 | 6d4c615ff105 | RingDouble-20-0.25- | rings |
| 1 | 1500.200401 | 0.025586 | 6 | rings_RingDouble-20-0.25-_331580_121311 | 0 | 0 | 6d4c615ff105 | RingDouble-20-0.25- | rings |
| 2 | 1500.400802 | 0.026157 | 6 | rings_RingDouble-20-0.25-_331580_121311 | 0 | 0 | 6d4c615ff105 | RingDouble-20-0.25- | rings |
| 3 | 1500.601202 | 0.026909 | 6 | rings_RingDouble-20-0.25-_331580_121311 | 0 | 0 | 6d4c615ff105 | RingDouble-20-0.25- | rings |
| 4 | 1500.801603 | 0.027305 | 6 | rings_RingDouble-20-0.25-_331580_121311 | 0 | 0 | 6d4c615ff105 | RingDouble-20-0.25- | rings |
| ... | ... | ... | ... | ... | ... | ... | ... | ... | ... |
| 495 | 1599.198397 | 0.027307 | 6 | rings_RingDouble-20-0.25-_331580_121311 | 0 | 0 | 6d4c615ff105 | RingDouble-20-0.25- | rings |
| 496 | 1599.398798 | 0.026967 | 6 | rings_RingDouble-20-0.25-_331580_121311 | 0 | 0 | 6d4c615ff105 | RingDouble-20-0.25- | rings |
| 497 | 1599.599198 | 0.025995 | 6 | rings_RingDouble-20-0.25-_331580_121311 | 0 | 0 | 6d4c615ff105 | RingDouble-20-0.25- | rings |
| 498 | 1599.799599 | 0.026009 | 6 | rings_RingDouble-20-0.25-_331580_121311 | 0 | 0 | 6d4c615ff105 | RingDouble-20-0.25- | rings |
| 499 | 1600.000000 | 0.025524 | 6 | rings_RingDouble-20-0.25-_331580_121311 | 0 | 0 | 6d4c615ff105 | RingDouble-20-0.25- | rings |
500 rows × 9 columns
Advanced queries#
To build advanced queries to filter metadata you can use the attribute_filter method. You can also use or_, and_ for conditional clauses.
Conditional filter#
data_tuples = dd.get_data_by_query(
    [dd.Project.project_id == PROJECT_ID, dd.Device.device_id == device_id]
)
len(data_tuples)
64
By default anything you pass to the list joins the clauses as and_
data_tuples = dd.get_data_by_query(
    [dd.and_(dd.Project.project_id == PROJECT_ID, dd.Device.device_id == device_id)]
)
len(data_tuples)
64
You can also use an OR condition.
The query below filters by project id PROJECT_ID AND either device id (ring-20-200 OR ring-20-150).
Because there are 21 measurements per device, one for each die, if you look for two specific devices.
device_id = "rings_RingDouble-20-200-_add_fiber_array_ea36ac06_331580_243771"

data_tuples = dd.get_data_by_query(
    [
        dd.Project.project_id == PROJECT_ID,
        dd.or_(
            dd.Device.device_id == device_id, dd.Device.device_id == device_id_radius20
        ),
    ]
)
len(data_tuples)
64
You can also combine conditionals.
In the example below, you can get all the data for the specified project id, device id and either die coordinate.
data_tuples = dd.get_data_by_query(
    [
        dd.Project.project_id == PROJECT_ID,
        dd.Device.device_id == device_id,
        dd.or_(
            dd.and_(dd.Die.x == 1, dd.Die.y == 1),  # either die 1,1
            dd.and_(dd.Die.x == 0, dd.Die.y == 0),  # or die 0,0
        ),
    ]
)
len(data_tuples)
0
Attribute filter#
You can filter attributes of any data models by passing a list of conditions as shown below.
You can use dd.Cell/dd.Wafer/..., key, value
You can only filter for values that are str, bool, int, float.
The query below filters Cells with waveguide gap 0.150 that are in a particular project and die coordinates.
device_data_objects = dd.get_data_by_query(
    [
        dd.attribute_filter(
            dd.Cell, "gap_um", 0.15
        ),  # checking for values in JSON attributes
        dd.Project.project_id == PROJECT_ID,
        dd.Die.x == 0,
        dd.Die.y == 0,
    ]
)
len(device_data_objects)
3
You can combine conditional and attribute filter clauses together.
You can get the data for Cells for a given project with 150nm 0um and either radius 20um or 10um
data_tuples = dd.get_data_by_query(
    [
        dd.Project.project_id == PROJECT_ID,
        dd.Die.x == 0,
        dd.Die.y == 0,
        dd.attribute_filter(
            dd.Cell, "gap_um", 0.15
        ),  # checking for values in JSON attributes
        dd.or_(
            dd.attribute_filter(dd.Cell, "radius_um", 20),
            dd.attribute_filter(dd.Cell, "radius_um", 10),
        ),
    ]
)
len(data_tuples)
2