Generate measurements#
For this tutorial you will generate some sample (fake) measurement data so you can post it to your project.
You’re going to create a new folder and populate it with JSON files containing the fake measurement data for the whole wafer.
import json
import pandas as pd
import numpy as np
from pathlib import Path
import matplotlib.pyplot as plt
df = pd.read_csv("device_table.csv")
df
| cell | x | y | components | |
|---|---|---|---|---|
| 0 | cutback_loss_2 | 33835 | 116310 | 816 |
| 1 | cutback_loss_1 | 529485 | 116310 | 400 |
| 2 | cutback_loss_0 | 516910 | 714861 | 16 |
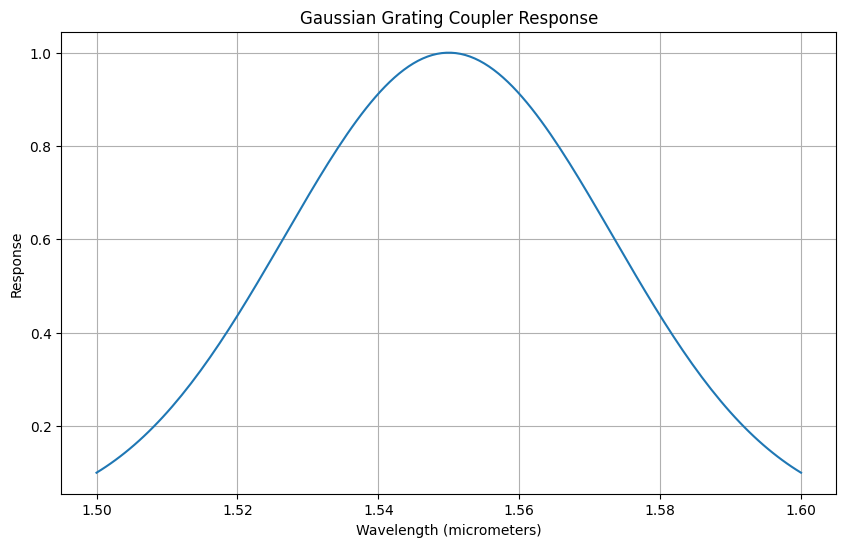
def gaussian_grating_coupler_response(
    peak_power, center_wavelength, bandwidth_1dB, wavelength
):
    """Calculate the response of a Gaussian grating coupler.

    Args:
        peak_power: The peak power of the response.
        center_wavelength: The center wavelength of the grating coupler.
        bandwidth_1dB: The 1 dB bandwidth of the coupler.
        wavelength: The wavelength at which the response is evaluated.

    Returns:
     The power of the grating coupler response at the given wavelength.
    """
    # Convert 1 dB bandwidth to standard deviation (sigma)
    sigma = bandwidth_1dB / (2 * np.sqrt(2 * np.log(10)))

    # Gaussian response calculation
    return peak_power * np.exp(-0.5 * ((wavelength - center_wavelength) / sigma) ** 2)


nm = 1e-3
# Parameters
peak_power = 1.0
center_wavelength = 1550 * nm  # Center wavelength in micrometers
bandwidth_1dB = 100 * nm

# Wavelength range: 100 nm around the center wavelength, converted to micrometers
wavelength_range = np.linspace(center_wavelength - 0.05, center_wavelength + 0.05, 150)

# Calculate the response for each wavelength
responses = [
    gaussian_grating_coupler_response(peak_power, center_wavelength, bandwidth_1dB, wl)
    for wl in wavelength_range
]

# Plotting
plt.figure(figsize=(10, 6))
plt.plot(wavelength_range, responses)
plt.title("Gaussian Grating Coupler Response")
plt.xlabel("Wavelength (micrometers)")
plt.ylabel("Response")
plt.grid(True)
plt.show()
def gaussian_grating_coupler_response(
    peak_power, center_wavelength, bandwidth_1dB, wavelength
):
    """Returns the power of the Gaussian grating coupler response at the given wavelength.

    Args:
        peak_power: The peak power of the response.
        center_wavelength: The center wavelength of the grating coupler.
        bandwidth_1dB: The 1 dB bandwidth of the coupler.
        wavelength: The wavelength at which the response is evaluated.
    """
    sigma = bandwidth_1dB / (2 * np.sqrt(2 * np.log(10)))
    response = peak_power * np.exp(
        -0.5 * ((wavelength - center_wavelength) / sigma) ** 2
    )
    return response
Generate wafer definitions#
You can define different wafer maps for each wafer.
wafer_definitions = Path("wafer_definitions.json")
wafers = ["6d4c615ff105"]
dies = [
    {"x": x, "y": y}
    for y in range(-3, 4)
    for x in range(-3, 4)
    if not (abs(y) == 3 and abs(x) == 3)
]

print(len(dies))
# Wrap in a list with the wafer information
data = [
    {
        "wafer": wafer_pkey,
        "dies": dies,
        "lot_id": "lot1",
        "attributes": {"doping_n": 1e-18},
        "description": "low doping",
    }
    for wafer_pkey in wafers
]

with open(wafer_definitions, "w") as f:
    json.dump(data, f, indent=2)
45
Generate and write spectrums#
You can easily generate some spectrum data and add some noise to make it look like a real measurement.
cwd = Path(".")
metadata = {"measurement_type": "Spectral MEAS", "temperature": 25}
top_cell_id = "cutback"
grating_coupler_loss_dB = 3

device_loss_dB = 0.1
noise_peak_to_peak_dB = device_loss_dB / 10
device_loss_noise_dB = device_loss_dB / 10 * 2

for wafer in wafers:
    for die in dies:
        die = f"{(die['x'])}_{(die['y'])}"
        for (_, row), (_, device_row) in zip(df.iterrows(), df.iterrows()):
            cell_id = row["cell"]
            device_id = f"{top_cell_id}_{cell_id}_{device_row['x']}_{device_row['y']}"
            dirpath = cwd / wafer / die / device_id
            dirpath.mkdir(exist_ok=True, parents=True)
            data_file = dirpath / "data.json"
            metadata_file = dirpath / "attributes.json"
            metadata_file.write_text(json.dumps(metadata))
            loss_dB = 2 * grating_coupler_loss_dB + row["components"] * (
                device_loss_dB + device_loss_noise_dB * np.random.rand()
            )
            peak_power = 10 ** (-loss_dB / 10)
            output_power = gaussian_grating_coupler_response(
                peak_power, center_wavelength, bandwidth_1dB, wavelength_range
            )
            output_power = np.array(output_power)
            output_power *= 10 ** (
                noise_peak_to_peak_dB * np.random.rand(len(wavelength_range)) / 10
            )
            output_power = 10 * np.log10(output_power)
            d = {
                "wavelength": wavelength_range * 1e3,
                "output_power": output_power,
            }
            data = pd.DataFrame(d)
            json_converted_file = data.reset_index(drop=True).to_dict(orient="split")
            json.dump(
                json_converted_file,
                open(data_file.with_suffix(".json"), "w+"),
                indent=2,
            )
dirpath
PosixPath('6d4c615ff105/2_3/cutback_cutback_loss_0_516910_714861')
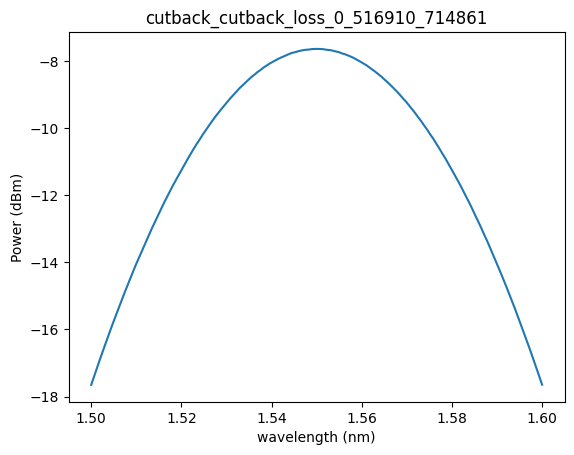
plt.plot(wavelength_range, output_power)
plt.title(dirpath.stem)
plt.ylabel("Power (dBm)")
plt.xlabel("wavelength (nm)")
Text(0.5, 0, 'wavelength (nm)')
f"{len(list(dirpath.parent.glob('*/*.json')))//2} measurements (3 widths * 6 lengths)"
'3 measurements (3 widths * 6 lengths)'
dirpath
PosixPath('6d4c615ff105/2_3/cutback_cutback_loss_0_516910_714861')
f"{len(list(dirpath.parent.parent.glob('*')))} dies"
'45 dies'