Layout#
The first step is to create a layout and test manifest for your project, so that you can relate measurements and analyses back to your source layout.
You can generate the layout with any layout tool. In this notebook you can use gdsfactory.
Generate layout#
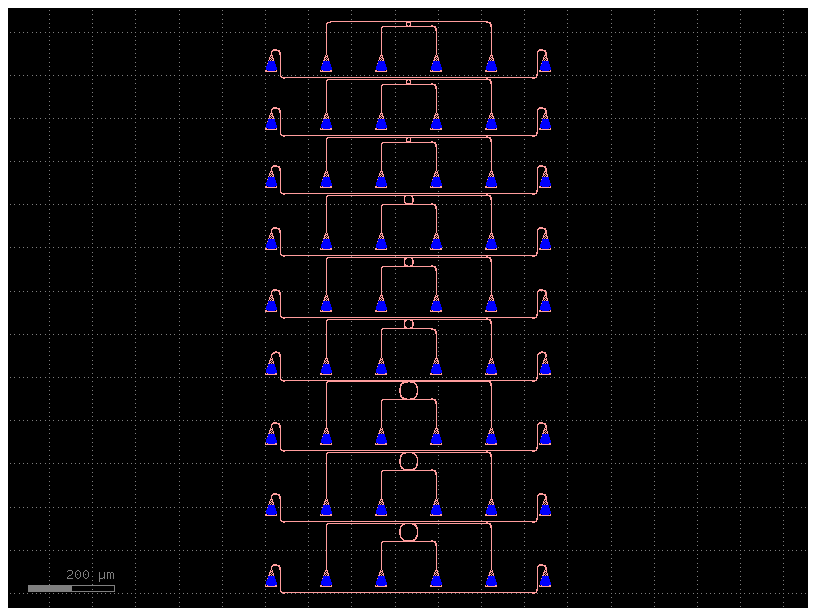
You can use generate_layout.py to create a GDS layout file with different rings.
from generate_layout import top

c = top()
c.write_gds("test_chip.gds")
c.plot()
Generate device table#
A design manifest is a table of devices and settings. A device contains the cell id, (x, y) locations and settings.
It can also optionally contain analysis and analysis_parameters that will trigger automated analysis when uploading new data associated to the device.
Here you can read them from the GDS and write a design manifest, which we can use to associate measurement data with the devices on the GDS. However, you can use any method you prefer to generate your test manifest.
import kfactory as kf
import csv

c = kf.kcl["top"]
rings = c.kcl["rings"]
csvpath = "design_manifest.csv"

analysis = "[fsr]"
analysis_parameters = '[{"height": -0.01, "distance": 20}]'

with open(csvpath, "w") as f:
    writer = csv.writer(f)
    writer.writerow(
        [
            "cell",
            "x",
            "y",
            "radius_um",
            "gap_um",
            "analysis",
            "analysis_parameters",
        ]
    )

    iterator = rings.kdb_cell.begin_instances_rec()
    iterator.targets = "Ring*"
    while not iterator.at_end():
        _c = c.kcl[iterator.inst_cell().cell_index()]
        name = _c.name
        if "RingDouble" in name:
            _disp = (iterator.trans() * iterator.inst_trans()).disp
            params = name.split("-")
            writer.writerow(
                [
                    name,
                    _disp.x,
                    _disp.y,
                    int(params[1]),
                    float(params[2]),
                    analysis,
                    analysis_parameters,
                ]
            )
        iterator.next()
You can take a look a the contents of the device manifest you created.
import pandas as pd

df = pd.read_csv(csvpath)
df
| cell | x | y | radius_um | gap_um | analysis | analysis_parameters | |
|---|---|---|---|---|---|---|---|
| 0 | RingDouble-20-0.25- | 331580 | 121311 | 20 | 0.25 | [fsr] | [{"height": -0.01, "distance": 20}] |
| 1 | RingDouble-20-0.2- | 331580 | 285371 | 20 | 0.20 | [fsr] | [{"height": -0.01, "distance": 20}] |
| 2 | RingDouble-20-0.15- | 331580 | 449331 | 20 | 0.15 | [fsr] | [{"height": -0.01, "distance": 20}] |
| 3 | RingDouble-10-0.2- | 331480 | 613191 | 10 | 0.20 | [fsr] | [{"height": -0.01, "distance": 20}] |
| 4 | RingDouble-10-0.15- | 331480 | 757151 | 10 | 0.15 | [fsr] | [{"height": -0.01, "distance": 20}] |
| 5 | RingDouble-10-0.1- | 331480 | 901011 | 10 | 0.10 | [fsr] | [{"height": -0.01, "distance": 20}] |
| 6 | RingDouble-5-0.2- | 331480 | 1044771 | 5 | 0.20 | [fsr] | [{"height": -0.01, "distance": 20}] |
| 7 | RingDouble-5-0.15- | 331480 | 1178731 | 5 | 0.15 | [fsr] | [{"height": -0.01, "distance": 20}] |
| 8 | RingDouble-5-0.1- | 331480 | 1312591 | 5 | 0.10 | [fsr] | [{"height": -0.01, "distance": 20}] |