Generate measurements#
For this tutorial you will generate some sample (fake) measurement data so you can post it to your project.
You’re going to create a new folder and populate it with JSON files containing the fake measurement data for the whole wafer.
import json
import pandas as pd
import numpy as np
from pathlib import Path
import matplotlib.pyplot as plt
df = pd.read_csv("design_manifest.csv")
df
| cell | x | y | width_um | length_um | analysis | analysis_parameters | |
|---|---|---|---|---|---|---|---|
| 0 | resistance_sheet_W10 | 0 | 52500 | 10.0 | 20 | [iv_resistance] | [{}] |
| 1 | resistance_sheet_W20 | 0 | 157500 | 20.0 | 20 | [iv_resistance] | [{}] |
| 2 | resistance_sheet_W100 | 0 | 262500 | 100.0 | 20 | [iv_resistance] | [{}] |
def iv_resistance(resistance, current) -> np.ndarray:
"""Returns IV.
Args:
resistance: in Ohms.
current: electrical intensity in A.
"""
v = resistance * current
return v
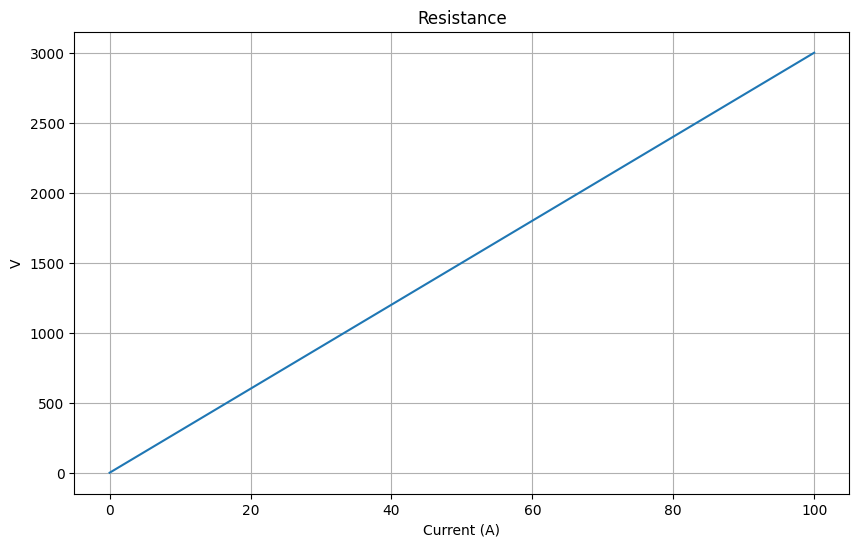
i = np.linspace(0, 100, 21)
v = iv_resistance(resistance=30, current=i)
plt.figure(figsize=(10, 6))
plt.plot(i, v)
plt.title("Resistance")
plt.xlabel("Current (A)")
plt.ylabel("V")
plt.grid(True)
plt.show()
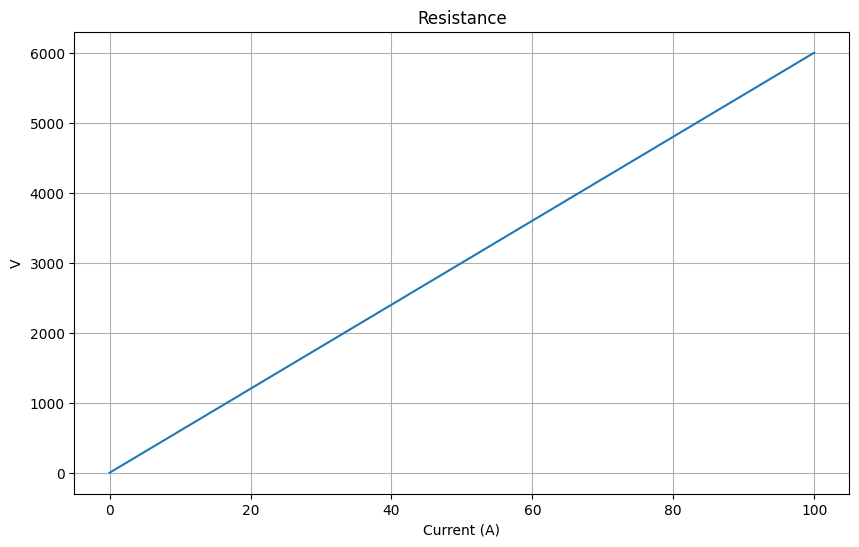
i = np.linspace(0, 100, 79)
v = iv_resistance(resistance=60, current=i)

plt.figure(figsize=(10, 6))
plt.plot(i, v)
plt.title("Resistance")
plt.xlabel("Current (A)")
plt.ylabel("V")
plt.grid(True)
plt.show()
Generate wafer definitions#
You can define different wafer maps for each wafer.

wafer_definitions = Path("wafer_definitions.json")
wafers = ["2eq221eqewq2", "334abd342zuq", "6d4c615ff105"]
dies = [
    {"x": x, "y": y}
    for y in range(-2, 3)
    for x in range(-2, 3)
    if not (abs(y) == 2 and abs(x) == 2)
]

# Wrap in a list with the wafer information
data = [{"wafer": wafer_pkey, "dies": dies} for wafer_pkey in wafers]

with open(wafer_definitions, "w") as f:
    json.dump(data, f, indent=2)
Generate and write data#
You can easily generate some data and add some noise to make it look like a real measurement.
wafers_path = Path("wafers")

metadata = {"measurement_type": "Spectral MEAS", "temperature": 25}

length = 20
ohms_per_square = 100

for wafer in wafers:
    wafer_per_cent_variation = 0.20  # 20% variation
    wafer_variation_factor = 1 + wafer_per_cent_variation * (2 * np.random.rand() - 1)

    for die in dies:
        die = f"{(die['x'])}_{(die['y'])}"
        for (_, row), (_, device_row) in zip(df.iterrows(), df.iterrows()):
            cell_id = row["cell"]
            basic_resistance = ohms_per_square * row["width_um"] * length * 1e-12
            device_per_cent_variation = 0.05  # 5% variation
            device_variation_factor = 1 + device_per_cent_variation * (
                2 * np.random.rand() - 1
            )
            resistance = (
                basic_resistance * wafer_variation_factor * device_variation_factor
            )

            # Special resistance cases (open and short circuits)
            rand_num = np.random.rand()
            if rand_num < 0.05:
                resistance = 3000  # 5% with infinite resistance (open circuit)
            elif rand_num < 0.08:  # Additional 3% (total 8% chance)
                resistance = 0  # 3% with zero resistance (short circuit)

            top_cell_id = "resistance"
            device_id = f"{top_cell_id}_{cell_id}_{device_row['x']}_{device_row['y']}"
            v = iv_resistance(resistance=resistance, current=i)
            noise = 5e-2 * np.random.rand(len(v)) * v  # add 5% noise
            v += noise
            dirpath = wafers_path / wafer / die / device_id
            dirpath.mkdir(exist_ok=True, parents=True)
            data_file = dirpath / "data.json"
            metadata_file = dirpath / "attributes.json"
            metadata_file.write_text(json.dumps(metadata))

            d = {
                "v": v,
                "i": i,
                "polyfit": resistance,
            }
            data = pd.DataFrame(d)
            json_converted_file = data.reset_index(drop=True).to_dict(orient="split")
            json.dump(
                json_converted_file,
                open(data_file.with_suffix(".json"), "w+"),
                indent=2,
            )
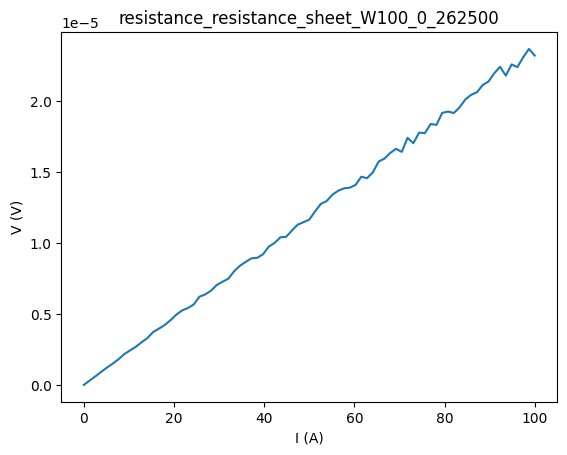
plt.plot(i, v)
plt.title(dirpath.stem)
plt.ylabel("V (V)")
plt.xlabel("I (A)")
Text(0.5, 0, 'I (A)')
f"{len(list(dirpath.parent.glob('*/*.json')))//2} measurements"
'3 measurements'
dirpath
PosixPath('wafers/6d4c615ff105/1_2/resistance_resistance_sheet_W100_0_262500')
f"{len(list(dirpath.parent.parent.glob('*')))} dies"
'21 dies'
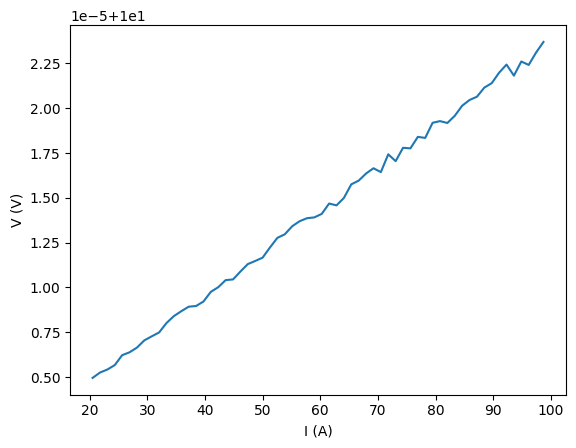
min_i = 20
max_i = None

min_i = min_i if min_i is not None else np.min(i)
max_i = max_i if max_i is not None else np.max(i)

i2 = i[(i > min_i) & (i < max_i)]
v2 = v[(i > min_i) & (i < max_i)] + 10

plt.plot(i2, v2)
plt.ylabel("V (V)")
plt.xlabel("I (A)")

p = np.polyfit(i2, v2, deg=1)
print(f"Sheet resistance {p[0]:.2f}")
Sheet resistance 0.00