Download data#
You can compose queries to download raw data.
import doplaydo.dodata as dd
import matplotlib.pyplot as plt
import pandas as pd
import getpass

username = getpass.getuser()

PROJECT_ID = f"cutback-{username}"
You have access to:
dd.Project
dd.Die
dd.Wafer
dd.ParentCell
dd.Cell
dd.Device
dd.DeviceData
Where each model has its table columns as attributes.
You can use get_data_by_query to query a subset of data filtered by a list of clauses.
It will return a list of tuples where the first element is a DeviceData object and the second one is a pandas DataFrame.
To retrieve specific data, we’ll use the GetDataByQuery function, which allows us to filter data by a list of clauses. In this example, we’ll filter by project ID.
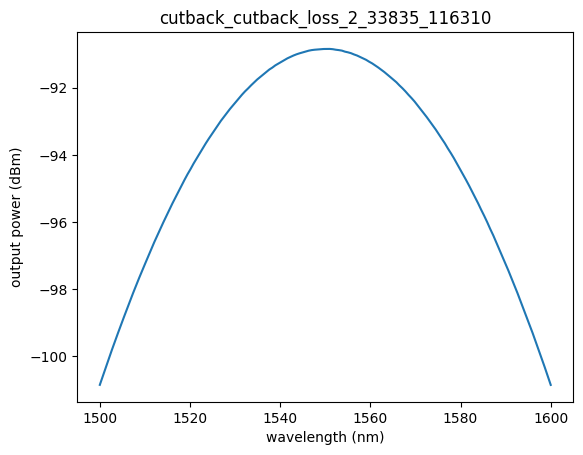
The GetDataByQuery function lets you retrieve data based on a list of specified filters. For example, here we filter by project ID and device ID with a specific name to obtain relevant device data. Part of this data is stored in a Pandas DataFrame with columns such as wavelength and output power. Plotting this data gives us a spectrum of wavelength vs. output power.
data_tuples = dd.get_data_by_query([dd.Project.project_id == PROJECT_ID], limit=1)
device_data, df = data_tuples[0]  # each tuple has DeviceData and pandas Dataframe
device_data
DeviceData(pkey=6097, thumbnail_path='device_data/6097/thumbnail.png', plotting_kwargs={'x_col': 'wavelength', 'y_col': ['output_power'], 'x_name': 'wavelength', 'y_name': 'output_power', 'scatter': False, 'sort_by': {}, 'x_units': None, 'y_units': None, 'grouping': {}, 'x_limits': None, 'y_limits': None, 'x_log_axis': False, 'y_log_axis': False}, valid=True, device_pkey=591, data_type=<DeviceDataType.measurement: 'measurement'>, path='device_data/6097/data.json.gz', attributes={}, die_pkey=624, timestamp=datetime.datetime(2025, 2, 28, 20, 57, 5, 808144), timestamp_acquired=None)
device_id = device_data.device.device_id
device_id
'cutback_cutback_loss_2_33835_116310'
df
| wavelength | output_power | |
|---|---|---|
| 0 | 1500.000000 | -100.844414 |
| 1 | 1500.671141 | -100.582852 |
| 2 | 1501.342282 | -100.321579 |
| 3 | 1502.013423 | -100.058873 |
| 4 | 1502.684564 | -99.801299 |
| ... | ... | ... |
| 145 | 1597.315436 | -99.800643 |
| 146 | 1597.986577 | -100.062362 |
| 147 | 1598.657718 | -100.315069 |
| 148 | 1599.328859 | -100.577509 |
| 149 | 1600.000000 | -100.846566 |
150 rows × 2 columns
plt.plot(df["wavelength"], df["output_power"])
plt.xlabel("wavelength (nm)")
plt.ylabel("output power (dBm)")
plt.title(device_id)
Text(0.5, 1.0, 'cutback_cutback_loss_2_33835_116310')
You can aggregate the dataframes and the device data objects
dfs = [dt[1] for dt in data_tuples]  # dataframes
dds = [dt[0] for dt in data_tuples]  # device data objects
The DeviceData object allows you to navigate the data model and access related fields across the hierarchy.
You can traverse from DeviceData to other tables by following the dashed arrows in the data structure, with each column representing an attribute of the corresponding table.
The database is organized into several hierarchical tables to streamline data relationships:
Projects: Each chip is assigned to a specific project.
Cells: Cells represent entities within a project.
Devices: Each cell instance corresponds to a device with defined X, Y coordinates.
Device_Data: Stores testing or simulation data for each device.
Analysis: Device data, dies, or wafers can be analyzed using specific analysis functions.
For each analysis, we track details such as the originating function, associated die, and wafer, ensuring a clear, structured relationship within the data. Additionally, wafers link back to projects, and dies are connected to their corresponding wafers.

We can also examine additional details, like the length of the data tuples and all metadata related to the device, including device ID, die origin (x, y coordinates), wafer ID, set ID, parent cell, and the associated project.
print("device id: ", dds[0].device.device_id)
print("die x: ", dds[0].die.x)
print("die y: ", dds[0].die.y)
print("wafer id: ", dds[0].die.wafer.wafer_id)
print("cell id: ", dds[0].device.cell.cell_id)
print("parent cell id: ", dds[0].device.parent_cell.cell_id)
print("project id: ", dds[0].device.cell.project.project_id)
device id:  cutback_cutback_loss_2_33835_116310
die x:  -2
die y:  0
wafer id:  6d4c615ff105
cell id:  cutback_loss_2
parent cell id:  cutback
project id:  cutback-runner
For example, you can access the Cell table and all its columns:
dds[0].device.cell
Cell(attributes={'x': 33835, 'y': 116310, 'components': 816, 'kfactory:info': "{'components': 816}", 'kfactory:ports:0': "{'cross_section': '78687732_10000', 'info': {}, 'name': 'o1', 'port_type': 'vertical_te', 'trans': r270 150500,-86240}", 'kfactory:ports:1': "{'cross_section': '78687732_10000', 'info': {}, 'name': 'o2', 'port_type': 'vertical_te', 'trans': r270 277500,-86240}", 'kfactory:ports:2': "{'cross_section': '78687732_10000', 'info': {}, 'name': 'loopback1', 'port_type': 'vertical_te', 'trans': r270 23500,-86240}", 'kfactory:ports:3': "{'cross_section': '78687732_10000', 'info': {}, 'name': 'loopback2', 'port_type': 'vertical_te', 'trans': r270 404500,-86240}"}, timestamp=datetime.datetime(2025, 2, 28, 20, 57, 5, 101094), cell_id='cutback_loss_2', pkey=592, project_pkey=18)
Build table for JMP#
You can build a flat table by combining all the device data and pandas dataframes.
data_tuples = dd.get_data_by_query(
    [
        dd.Project.project_id == PROJECT_ID,
        dd.Device.device_id == device_id,  # only get data for this device
        dd.Die.x == 0,
        dd.Die.y == 0,
    ]
)
len(data_tuples)
dds = [dt[0] for dt in data_tuples]  # device data objects
dfs = [dt[1] for dt in data_tuples]  # dataframes
dfs[0]
| wavelength | output_power | |
|---|---|---|
| 0 | 1500.000000 | -112.366562 |
| 1 | 1500.671141 | -112.097243 |
| 2 | 1501.342282 | -111.837020 |
| 3 | 1502.013423 | -111.580424 |
| 4 | 1502.684564 | -111.327843 |
| ... | ... | ... |
| 145 | 1597.315436 | -111.327558 |
| 146 | 1597.986577 | -111.575368 |
| 147 | 1598.657718 | -111.842677 |
| 148 | 1599.328859 | -112.102890 |
| 149 | 1600.000000 | -112.371986 |
150 rows × 2 columns
dfs_all = []

for device_data, df in zip(dds, dfs):
    df["device_id"] = device_data.device.device_id
    df["die_x"] = device_data.die.x
    df["die_y"] = device_data.die.y
    df["wafer_id"] = device_data.die.wafer.wafer_id
    df["cell_id"] = device_data.device.cell.cell_id
    df["parent_cell_id"] = device_data.device.parent_cell.cell_id
    dfs_all.append(df)
dfs_all = pd.concat(dfs_all)  # You can concatenate all dataFrames together
dfs_all
| wavelength | output_power | device_id | die_x | die_y | wafer_id | cell_id | parent_cell_id | |
|---|---|---|---|---|---|---|---|---|
| 0 | 1500.000000 | -112.366562 | cutback_cutback_loss_2_33835_116310 | 0 | 0 | 6d4c615ff105 | cutback_loss_2 | cutback |
| 1 | 1500.671141 | -112.097243 | cutback_cutback_loss_2_33835_116310 | 0 | 0 | 6d4c615ff105 | cutback_loss_2 | cutback |
| 2 | 1501.342282 | -111.837020 | cutback_cutback_loss_2_33835_116310 | 0 | 0 | 6d4c615ff105 | cutback_loss_2 | cutback |
| 3 | 1502.013423 | -111.580424 | cutback_cutback_loss_2_33835_116310 | 0 | 0 | 6d4c615ff105 | cutback_loss_2 | cutback |
| 4 | 1502.684564 | -111.327843 | cutback_cutback_loss_2_33835_116310 | 0 | 0 | 6d4c615ff105 | cutback_loss_2 | cutback |
| ... | ... | ... | ... | ... | ... | ... | ... | ... |
| 145 | 1597.315436 | -111.327558 | cutback_cutback_loss_2_33835_116310 | 0 | 0 | 6d4c615ff105 | cutback_loss_2 | cutback |
| 146 | 1597.986577 | -111.575368 | cutback_cutback_loss_2_33835_116310 | 0 | 0 | 6d4c615ff105 | cutback_loss_2 | cutback |
| 147 | 1598.657718 | -111.842677 | cutback_cutback_loss_2_33835_116310 | 0 | 0 | 6d4c615ff105 | cutback_loss_2 | cutback |
| 148 | 1599.328859 | -112.102890 | cutback_cutback_loss_2_33835_116310 | 0 | 0 | 6d4c615ff105 | cutback_loss_2 | cutback |
| 149 | 1600.000000 | -112.371986 | cutback_cutback_loss_2_33835_116310 | 0 | 0 | 6d4c615ff105 | cutback_loss_2 | cutback |
150 rows × 8 columns
Advanced queries#
To build advanced queries to filter metadata you can use the attribute_filter method. You can also use or_, and_ for conditional clauses.
Conditional filter#
data_tuples = dd.get_data_by_query(
    [
        dd.Project.project_id == PROJECT_ID,
        dd.Device.device_id == device_id,  # only get data for this device
    ]
)
len(data_tuples)
45
By default anything you pass to the list joins the clauses as and_
data_tuples = dd.get_data_by_query(
    [
        dd.and_(
            dd.Project.project_id == PROJECT_ID,
            dd.Device.device_id == device_id,  # only get data for this device
        )
    ]
)
len(data_tuples)
45
You can also use an OR condition.
The query below filters by project id PROJECT_ID AND either device id
Because there are 45 measurements per device, one for each die, if you look for two specific devices, you will get 90 measurements.
device_id2 = "cutback_cutback_loss_1_529485_116311"

data_tuples = dd.get_data_by_query(
    [
        dd.Project.project_id == PROJECT_ID,
        dd.or_(dd.Device.device_id == device_id, dd.Device.device_id == device_id2),
    ]
)
len(data_tuples)
45
You can also combine conditionals.
In the example below, you can get all the data for the specified project id, device id and either die coordinate.
data_tuples = dd.get_data_by_query(
    [
        dd.Project.project_id == PROJECT_ID,
        dd.Device.device_id == device_id,  # only get data for this device
        dd.or_(
            dd.and_(dd.Die.x == 1, dd.Die.y == 1),  # either die 1,1
            dd.and_(dd.Die.x == 0, dd.Die.y == 0),  # or die 0,0
        ),
    ]
)
len(data_tuples)
2
Attribute filter#
You can filter attributes of any data models by passing a list of conditions as shown below.
You can use dd.Cell/dd.Wafer/..., key, value
You can only filter for values that are str, bool, int, float.
The query below filters Cells with 400 components in the cutback that are in a particular project and die coordinates.
device_data_objects = dd.get_data_by_query(
    [
        dd.attribute_filter(
            dd.Cell, "components", 400
        ),  # checking for values in JSON attributes
        dd.Project.project_id == PROJECT_ID,
        dd.Die.x == 0,
        dd.Die.y == 0,
    ]
)
len(device_data_objects)
1
You can combine conditional and attribute filter clauses together.
You can get the data for Cells for a given project with 400 or 816 components in the cutback
data_tuples = dd.get_data_by_query(
    [
        dd.Project.project_id == PROJECT_ID,
        # dd.attribute_filter(dd.Cell, "components", 400),
        dd.or_(
            dd.attribute_filter(dd.Cell, "components", 400),
            dd.attribute_filter(dd.Cell, "components", 816),
        ),
    ]
)
len(data_tuples)
90