Generate Layout#
The first step is to create a layout and test manifest for your project, so that you can relate measurements and analyses back to your source layout.
You can generate the layout with any layout tool. In this notebook you can use kfactory.
Generate layout#
Kfactory allows you to write metadata directly into the cell
You can download this generate_layout.py file
import kfactory as kf
from generate_layout import top
import csv
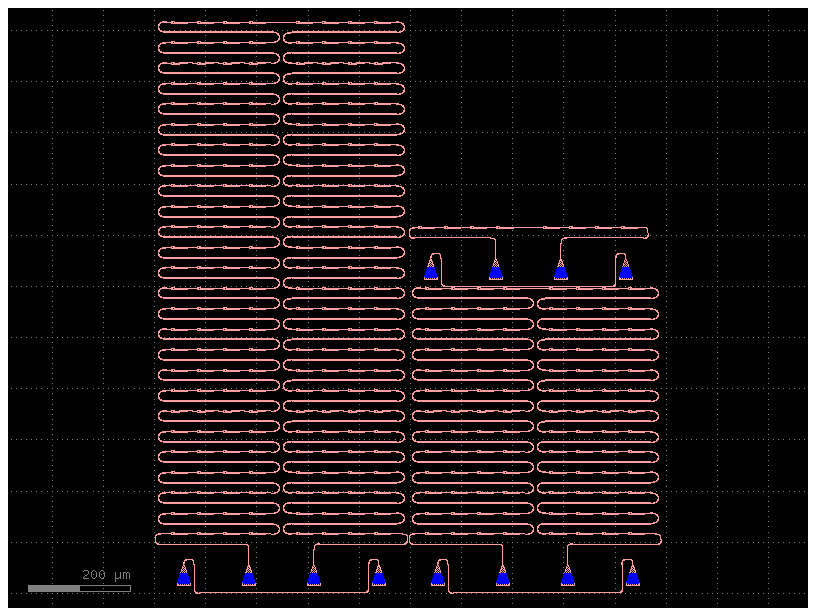
c = top()
c.write_gds("test_chip.gds")
c.plot()
Generate device table#
For generating the device table you need to use Kfactory.
A device needs the X, Y position on the layout. Note that you can instantiate a Cell many times into a die.
import kfactory as kf
import csv

sweep = c.kcl["cutback"]
csvpath = "device_table.csv"

analysis = "[cutback]"
analysis_parameters = "[{}]"
length = 20

with open(csvpath, "w") as f:
    writer = csv.writer(f)
    writer.writerow(
        [
            "cell",
            "x",
            "y",
            "components",
            # "analysis",
            # "analysis_parameters",
        ]
    )
    iterator = sweep.kdb_cell.begin_instances_rec()
    iterator.targets = "cutback_loss*"
    while not iterator.at_end():
        _c = c.kcl[iterator.inst_cell().cell_index()]
        name = _c.name
        _disp = (iterator.trans() * iterator.inst_trans()).disp
        params = name.split("-")  # we extract the width from the device name
        writer.writerow(
            [
                name,
                _disp.x,
                _disp.y,
                _c.info["components"],
                # analysis,
                # analysis_parameters,
            ]
        )
        iterator.next()
You can take a look a the contents of the device manifest you created.
import pandas as pd

dt = pd.read_csv(csvpath)
dt
| cell | x | y | components | |
|---|---|---|---|---|
| 0 | cutback_loss_2 | 33835 | 116310 | 816 |
| 1 | cutback_loss_1 | 529485 | 116310 | 400 |
| 2 | cutback_loss_0 | 516910 | 714861 | 16 |
dt.to_csv("device_table.csv", index=False)